How does your law enforcement organization turn traffic stop data into actionable intelligence? How about aggregating and compiling traffic stop data for state-mandated reports, such as the yearly racial profiling report required by the state of Texas?
Introducing Trusted Driver Data & Analytics – a powerful and easy-to-use platform that provides law enforcement agencies with real-time insights into their traffic enforcement operations. With its intuitive dashboard, officers and command staff can quickly access critical information on e-citations – or electronic citations, driver demographics, vehicles, and locations.
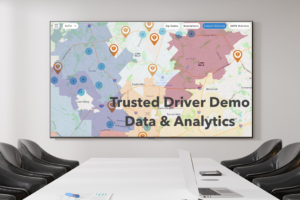 |
Mapping the DataTrusted Driver Data & Analytics utilizes a user-friendly map interface to provide geo-spatial electronic citation data according to zip code, police district, city council or precinct district, or by a custom radius determined by the user. With this feature, a user can isolate and view information in a specific location, such as a neighborhood or the area around a school or college campus. |
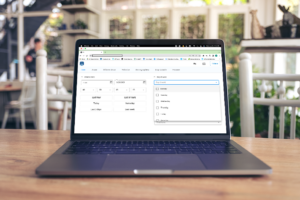 |
Accessing Raw DataUsers can also access raw electronic citation — or e-ticketing — data within Trusted Driver Data & Analytics. An invaluable feature here – is the ability to narrow down the data to include as many filters as necessary, such as filtering citations since the start of the year or over the course of a select few months. |
State-Mandated Reporting
Accessing the raw citation data leads to another unique innovation of Trusted Driver Data & Analytics – the ability to easily generate reports to comply with state mandates. Rather than paying a third party to aggregate and compile traffic citation data, let Trusted Driver Data & Analytics do the work for you. Driver demographic information, such as race and ethnicity can be exported and submitted to comply with state-mandated requirements, such as the racial profiling documentation required by the state of Texas.
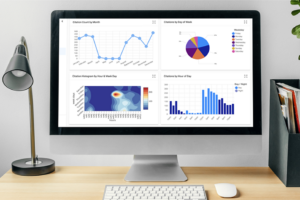 |
Interactive VisualizationsTrusted Driver Data & Analytics provides interactive visualizations to enhance e-citation data exploration. Users can leverage charts, graphs, and maps to gain visual understanding, revealing patterns, trends, and correlations that may have remained hidden in the raw data of electronic traffic tickets. |
Conclusion
Overall, the versatility of Trusted Driver Data & Analytics makes it indispensable to various stakeholders. Law enforcement command leaders can identify traffic ticketing patterns, allocate resources effectively, and enhance safety measures; City planners can analyze traffic safety concerns and plan infrastructure improvements accordingly; And community policymakers can make data-driven decisions based on comprehensive insights, leading to more effective policies, strategies and real-world applications.
With its user-friendly interface and comprehensive data reporting, it offers officers and command staff the electronic citation insights they need to make informed decisions and enhance public safety.
E-Citation
Want to know more about our innovative electronic ticketing platform, Trusted Driver E-Citation? You can learn more by clicking here or by requesting a demo here.
Watch: Trusted Driver’s Data & Analytics
Ready to contact Trusted Driver?
Trusted Driver streamlines interactions with the public, optimize city resources with virtual courtrooms and lower costs with paperless citation and fine collection. If you work in law enforcement or city/county government, you can schedule a private, guided demo led by the Trusted Driver team and discover all the features and benefits firsthand.
Ready to contact Trusted Driver?
It’s free and only takes a few minutes. Find your city below or sign up for notifications whenever Trusted Driver is available in your area.